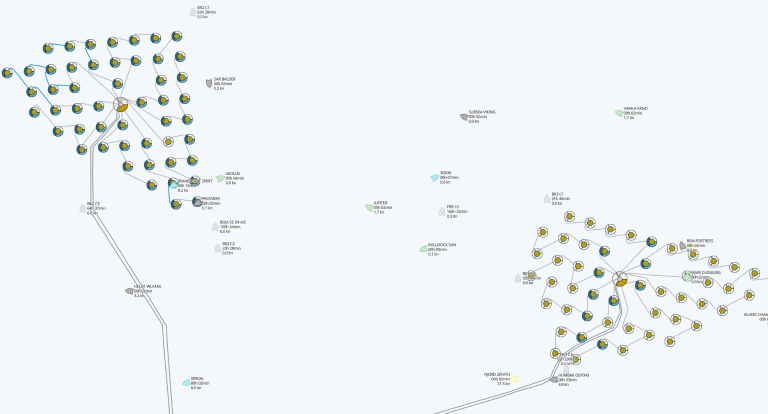

Our free weather downtime modeling tool, ESOX, just got better with the newly added custom Hs/Tp curve constraints for floating operations.
Hs/Tp curves are used to describe how certain wave frequencies (Tp = peak wave period) decrease the size of waves (Hs = significant wave height) that an operation can be undertaken in.
User-Defined Curves
Floating operations in relatively small waves – but with wave frequencies close to the natural frequency (eigenfrequency) of the vessel – can make a large vessel roll from side to side. ESOX can now identify if conditions are above or below the Hs/Tp curve, using up to six user-defined curves.
See how the newly added functionality to include custom Hs/Tp curves in the simulation of floating operations works in the video below:
Stay Up to Date about ESOX
Download the latest version of ESOX from esox.lautec.com and sign up for our newsletter to receive updates on new ESOX functionalities.